
AI-assisted root-cause analysis and reporting platform for production data
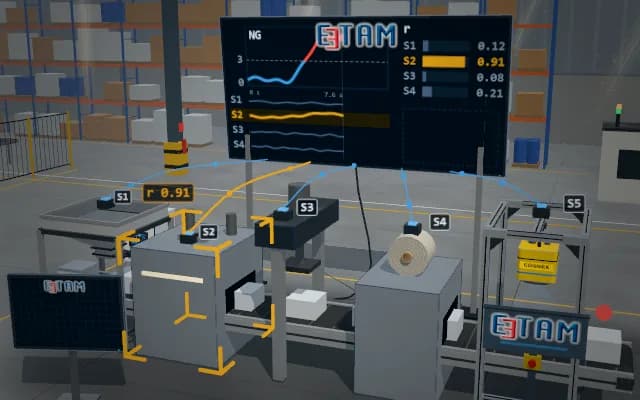
Process data and inspection results from the stations are collected in one dashboard. When the defect trend rises, an AI model flags the parameter that moves with it as the probable root cause and drafts a report; the decision stays with the process owner.
The relevant station, correlation and event interval are written to a report draft. The draft is transferred to the operator terminal; review by the process owner is awaited before a parameter change.
- 01 Data
- 02 Trend
- 03 Correlate
- 04 Report
The stations send process data and inspection results to the dashboard.
- Defect count
- —
- Correlation
- —
- Probable source
- —
Scenes are illustrative simulations; they are not customer references or performance guarantees.
Need
Station process records arrive at different times; the inspection result for a product is delayed. Two trends that vary together do not by themselves prove a causal relationship.
Solution approach
Station data and final-camera results are aligned by product order and time. The panel shows a threshold crossing; AI compares covarying parameters and highlights a possible source. Correlation and the event window are added to a report draft for validation by the process owner.
Process steps
- 01
Data
The stations send process data and inspection results to the dashboard.
- 02
Trend
The defect count at final inspection rises and crosses the threshold line.
- 03
Correlate
The AI model highlights the station parameter that moves together with the trend.
- 04
Report
The draft report reaches the operator screen; the process owner decides.
Related applications


Let us assess your application together
We test your sample in our laboratory and report on resolution, optics and lighting selection.