
Glass stress test
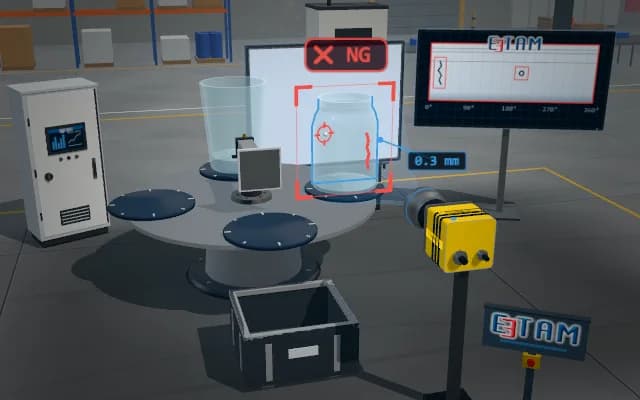
The glass item is placed between a polarised backlight and a camera with an analyser. In the crossed-polariser image, zones of residual stress light up; retardation is derived from the analyser angle and the high-stress zone is flagged. A sample above the limit is pushed off the rotary table.
Extinction angle, retardation and stress are written to the sample record; a jar above the limit is pushed into the chute after the table indexes, and a new sample is taken from the infeed conveyor in its place. The result is shown on the stack light.

- 01 Positioning
- 02 Dark field
- 03 Retardation
- 04 Decide
The rotary table brings the sample between the polarised backlight and the camera.
- Analyser angle
- —
- Retardation
- —
- Stress
- —
Scenes are illustrative simulations; they are not customer references or performance guarantees.
Need
Residual stress in glass is invisible to the eye and to ordinary imaging; it only appears as birefringence in polarised light. Stress concentrates at thick-to-thin transitions such as the heel and the shoulder; the curvature of the jar wall also deflects light and can give misleading brightness.
Solution approach
The sample is held between a polarised backlight and a camera with a rotating analyser. The analyser is first set to the crossed position: unstressed glass stays dark, stressed zones glow. The analyser is then rotated until the measuring point goes dark; the angle on the extinction curve gives the retardation, and the retardation the stress.
Process steps
- 01
Positioning
The rotary table brings the sample between the polarised backlight and the camera.
- 02
Dark field
The analyser turns to the crossed position; the background darkens and stressed zones stay bright.
- 03
Retardation
The analyser is rotated until the measuring point goes dark; the angle on the extinction curve gives the retardation.
- 04
Decide
Peak retardation and the corresponding stress are compared with the limit; a non-conforming sample is pushed into the chute after the table indexes.
Related applications



Let us assess your application together
We test your sample in our laboratory and report on resolution, optics and lighting selection.