
Precise colour analysis of plastic components
Each part is measured by a colour sensor under the diffuse light of a dome; its L*a*b* values are compared with the reference part to compute ΔE. Shade drift across the batch is followed on a trend chart and an out-of-tolerance part is removed.
The ΔE, ΔL*, Δa*, Δb* values of every part are written to the batch record; an out-of-tolerance part is pushed off the table. The trend chart is shown on the operator display and an alarm goes to the line PLC as the limit approaches.
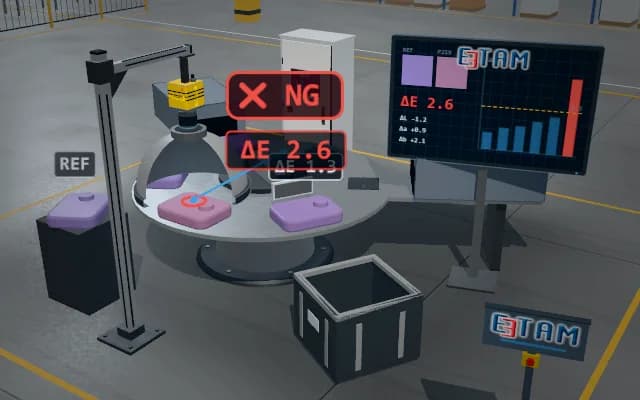
- 01 Index
- 02 Measure
- 03 ΔE analysis
- 04 Decide
The dial table indexes one step and brings the next part under the measuring head.
- ΔE*ab
- —
- ΔL*
- —
- Δb*
- —
Scenes are illustrative simulations; they are not customer references or performance guarantees.
Need
On a glossy plastic surface glare and shadow mask or exaggerate a shade difference the eye cannot resolve; the same part reads differently as the viewing angle and ambient light change. Shade drift develops slowly across the batch and is invisible on a single part.
Solution approach
The dome light lights the surface evenly from all directions, removing glare and shadow; the sensor looks through the hole at the top of the dome at the same spot and angle. The reading is referenced to a master part measured under the same conditions; ΔE comes from the L*, a*, b* differences. The dial table brings every part to the same spot; the batch trend is charted and drift is seen early.
Process steps
- 01
Index
The dial table indexes one step and brings the next part under the measuring head.
- 02
Measure
The dome light strobes and the sensor measures the surface colour free of glare.
- 03
ΔE analysis
The L*a*b* values are compared with the reference and the result is added to the batch trend.
- 04
Decide
ΔE is compared with the tolerance limit.
Related applications




Let us assess your application together
We test your sample in our laboratory and report on resolution, optics and lighting selection.